Imagine a product team who are excited about launching their latest feature but they forgot to consider user feedback. What would be the result? It could potentially be disastrous! Low adoption rates, negative reviews, and a frustrated user base.
This scenario highlights the importance of User Experience (UX) Metrics. By tracking key metrics, product teams can better understand user behavior, identify pain points and make data-driven decisions to improve user experience.
In this article, we will explore the power of UX metrics and how to use them to drive product success and also convince your stakeholders.
What Are UX Metrics?
UX, like any industry, relies on metrics to improve. The food industry uses metrics for taste, texture, and cost. Similarly, UX uses metrics to measure user satisfaction, engagement, and overall experience.
There are 2 main types of UX metrics:
- Quantitative data: Focus on how users interact with a product or service, such as task completion rate, error rate, etc.
- Qualitative data: Focus on how users feel about a product or service, such as user satisfaction, perception and engagement.
By analyzing these metrics, product teams can make data-driven decisions that improve product usability, engagement, and overall user experience. Here are how UX metrics influence product decisions:
- Prioritize features: Identify the most valuable features to focus on.
- Identify usability issues: Pinpoint areas where the user experience can be improved.
- Optimize user flows: Streamline user journeys and reduce drop-off rates.
- Personalize the user experience: Tailor the experience to individual user needs.
- Validate concepts: Assess the potential success of a new feature or product before development.
Take the next step: Discover real-world case studies or master key UX metrics and methods.
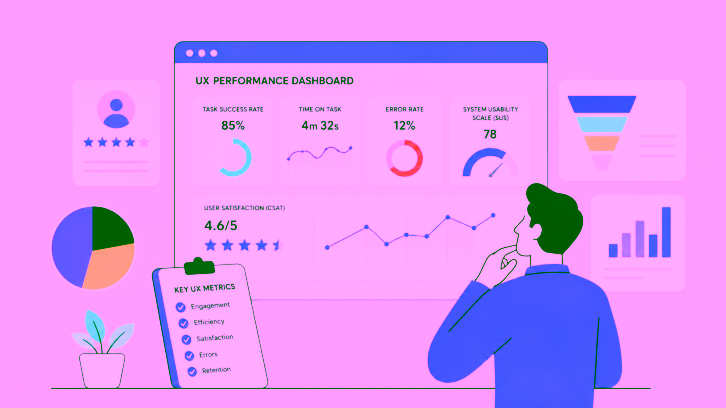
Key UX Metrics Every Designer Should Track For Product Success
Be selective and choose metrics which directly impact your key objectives. Don’t measure everything just because it’s possible.
According to usability experts Tom Tullis and Bill Albert, the best UX metrics should:
- Be time-bound, such as weekly, monthly, or quarterly.
- Have a benchmark.
- Be observable, measurable and quantifiable.
- Be actionable in informing specific product decisions.
- Directly impact key business metrics such as revenue, customer satisfaction, or retention.
Let’s delve deeper into key UX metrics and methods for tracking, collecting, and analyzing user data.
1. Performance Metrics
Performance metrics such as speed, responsiveness, and reliability measure how well a product or service functions technically.
Performance metrics like loading times may not directly gauge user satisfaction but significantly affect user experience. We will also use qualitative research for deeper insights.
Methods for Tracking Performance Data
To obtain these metrics, utilize tools and research methods such as:
- Web analytics tools like Google Analytics. Consider these UX analytic tools.
- User Testing or A/B Testing tools like UXArmy.
- Log Analysis like user behavior logs.
Key Metrics
Here are some key metrics to consider:
- Page load time: Tracks the time for a web page to fully load.
- Server response time: Measures the time it takes for a server to respond to a request.
- Error rate: Measures how often errors or crashes occur.
- Efficiency: Track the number of clicks, taps, and screen swipes required to complete a task.
- Task completion rate: Evaluate how many users can complete specific tasks.
- Time-on-task: Measure how long it took for users to complete a task.
- User satisfaction: Gauge how satisfied users are with the product.
2. Usability Metrics
Usability metrics measure how easy it is for users to interact with a product. They focus on the user’s experience and satisfaction.
If you’re developing a new or redesigned product or service, use these metrics to identify areas for improvement and evaluate new features or websites before development.
Methods for Collecting Usability Issues
These usability issues can be identified through usability and prototype testing before the development phase.
Key Metrics
Here are some key metrics to consider:
- Task completion rate: Evaluate how well users can complete specific tasks.
- Time-on-task: Measure how long users completed a task.
- Errors: Measures how often errors or crashes occur.
- Efficiency:Track the number of clicks, taps, and screen swipes required to complete a task.
- Learnability: Track how performance evolves.
- User satisfaction: Gauge how satisfied users are with the product.
- System Usability Scale (SUS): A standardized questionnaire to measure perceived ease of use.
3. User Satisfaction Metrics
User satisfaction metrics track users’ satisfaction with your product or service.
To boost customer satisfaction and attract happy customers, it’s crucial to understand their needs at each stage of the user journey to optimize the experience.
Methods for Measuring Satisfaction
If your product is currently under development, it’s essential to understand how potential users feel about your solutions.
- Perform user testing or prototype testing with post-test surveys
If the product is already live, it is vital to monitor whether your customers are happy, using these methods
- Surveys and questionnaires, such as post-launch, NPS, and CSAT surveys.
Key Metrics
Here are some key metrics to consider:
- Net Promoter Score (NPS): Measures customer loyalty and satisfaction.
- Customer Satisfaction Score (CSAT): Measures overall satisfaction with specific interactions or experiences.
- User Surveys and Questionnaires: Collect feedback on user experiences, including ease of use, feature satisfaction, and overall experience.
4. User Engagement Metrics
User engagement metrics assess how actively users interact with your product or website. Tracking these metrics aims to uncover user behavior, preferences, and satisfaction.
These insights will help the product team analyze how their product is being used, encouraging them to think creatively about ways to improve it.
Methods for Tracking Engagement
Use a mix of tools and techniques to gather user engagement metrics effectively:
- Web and mobile analytics tools like Google Analytics and Firebase.
- User testing tools which offer heatmaps, surveys and session recording, such as Hotjar.
Key Metrics
Here are some key metrics to consider:
- Session duration: Measures the average time users spend on a feature or website.
- Click-through rate (CTR): Evaluate the effectiveness of calls to action and links.
- User retention rate: Percentage of users who return to a product or website over time.
- Feature usage: Track how often users interact with specific features.
5. User Behavior Metrics
User behavior metrics track how users interact with your app or website. These metrics offer a holistic view of the customer experience within your product.
They provide quantitative data on actions like clicks, sign-ups, and feature usage, helping you understand user preferences and identify areas for improvement.
Methods for Analyzing Behavioral Data
Here are some effective analysis methods to consider:
- A/B testing & experimentation
- Funnel analysis
- Retention and engagement analysis
- Segment analysis
Key Metrics
Here are some key metrics to consider:
- Session duration: Measures the average time users spend on a feature or website.
- Page views per session: Monitor the average number of pages a user views during a session.
- Bounce rate: Monitor the percentage of visitors who leave a website after viewing only one page.
- Click-through rate (CTR): Monitor the percentage of users who click on a specific link or call to action.
- Conversion rate: Track the percentage of users who complete a desired action, such as purchasing or signing up.
- Time-on-page: Measure the average time a user spends on a specific page.
- User retention rate: The percentage of users who return to a website or app over time.
How To Communicate UX Insights Effectively
You’ve identified key UX metrics to track and analyze. Now, let’s ensure stakeholders support your UX efforts. If stakeholders are receptive, your valuable research could be noticed.
Understanding stakeholder types is crucial. As UX Insight suggests, there are 3 main categories: novices, enthusiasts, and skeptics.
In this section, we will tailor presentations to each type of stakeholder.
Pro Tip: After working in design agencies for over ten years, I learned to perform stakeholder analysis to understand clients and build relationships. I recommend doing this if you are joining a new team, or working with a new client.
1. The Novice Stakeholder
Novice stakeholders may be unfamiliar with user research and hesitant to invest time and resources until they see the product’s benefits.
When presenting UX metrics, focus on delivering clear and actionable insights. Here are ways to communicate UX metrics effectively:
- Involve them in every stage of the project to foster trust.
- Present the most critical insights clearly and concisely.
- Use simple language and avoid industry-specific terms.
- Show UX improvements that can significantly boost revenue, lower customer support costs, and enhance brand reputation.
- Share case studies of companies successfully using UX to drive business growth.
- Offer actionable recommendations based on the data.
- Avoid overpromising and underdelivering.
2. The Enthusiast Stakeholder
This group is eager to leverage UX research to analyze data and make informed decisions. However, they may become overly enthusiastic, potentially overanalyzing minor details like button color or image choice.
When presenting UX metrics, emphasize data visualization and balance thoroughness with efficiency.
- Discuss costs and help prioritize high-risk areas for research activities.
- Share granular data, like unexpected findings and detailed metrics.
- Analyze specific user segments or scenarios to uncover niche insights.
- Work together to define research goals and objectives.
- Invite them to participate in user interviews, usability tests, or surveys.
- Use a variety of charts, graphs, and maps to present data in engaging ways.
3. The Skeptical Stakeholder
The Skeptical stakeholders may have had negative experiences and struggles to see how UX can help them make better decisions.
When presenting UX metrics, address their concerns and provide concrete evidence.
- Connect UX research to tangible business outcomes like increased revenue, reduced costs, or improved customer satisfaction.
- Speak their language and avoid jargon.
- Provide concrete evidence by sharing real-life examples.
- Invite them to participate in user interviews, usability tests, or design reviews.
- Quantify the impact of UX on key business metrics.
My major takeaway is that stakeholders are people, too, and building trust with them is the key. To ensure stakeholder buy-in, prioritize clear communication and actionable insights.
Real-Life Examples of Metrics Driving Design Decisions
Let’s explore case studies that utilize data-driven decisions to improve user experience and drive business growth.
Case study: Thinking Fast and Slow in the Netflix TV User Interface.
Tom Tullis and Bill Albert share 5 compelling case studies in their book, ‘Measuring the User Experience: Collecting, Analyzing, and Presenting UX Metrics.‘
- Problem: Struggling to find relevant content, leading to decreased user satisfaction and engagement.
- Methods: In-depth interview and eye-tracking
- Metric: Navigation efficiency, task success rate, user satisfaction, time spent on screen, click-through rate
- Solution: Redesigned a personalized box-art on the homepage through UI tactics and algorithmic optimization, helping over 100 million users find great content to watch.
Case study: An E-learning Site Offers Online Courses Specifically Designed for Creators.
Angie Ricciardi at Learn Dash presents this case study, which highlights:
- Problem: High dropout rates in online courses.
- Methods: Exit surveys, in-depth interviews, online community engagement, activity logs
- Metric: Course completion rate
Solution: Implemented interactive elements, gamification, and personalized learning paths. This resulted in a significant increase in course completion rates.
Leveraging UX Metrics for Success
While business, marketing, and UX metrics have distinct focuses, they all contribute to a shared goal: driving business success.
Using tools and techniques to track, collect and analyze data, UX professionals help product teams make informed decisions that enhance customer experience and drive long-term growth.
Knowing your stakeholders and building trust helps you convince your stakeholders to buy in.
UXArmy enables continuous analysis and optimization of metrics, optimises UIs, facilitates A/B testing, and enhances overall user experience and satisfaction.
Try UXArmy for free and start leveraging real-time data analysis, A/B testing, and UI optimization to make smarter, data-driven decisions and showcase the value of great UX to your stakeholders.
Frequently asked questions
What are UX metrics and why do they matter?
UX metrics quantify how people use and feel about a product (e.g., task success, time on task, errors, satisfaction). They help prioritize features, spot usability issues, and prove value to stakeholders.
What’s the difference between quantitative and qualitative UX metrics?
Quantitative numbers (task-completion rate, time, errors, conversions). Qualitative the “why” (interviews, observations, open comments). Use both for a complete picture.
Which core usability metrics should every team track?
Start with success rate, time on task, error rate, and user satisfaction they’re foundational and easy to compare over time.
What is the HEART framework and how does it guide UX metrics?
HEART Happiness, Engagement, Adoption, Retention, Task Success + a Goals-Signals-Metrics mapping process to link product goals to the right KPIs.
What are AARRR (Pirate) metrics and how do they relate to UX?
AARRR tracks Acquisition, Activation, Retention, Referral, Revenue across the customer lifecycle; pair with UX metrics to connect experience to growth.
How do I measure perceived usability quickly (SUS score)?
Use the System Usability Scale (SUS), a 10-item validated survey; compute the SUS usability score with a SUS score calculator to benchmark ease of use.
NPS vs. CSAT: which satisfaction metric should I use?
gauges loyalty/likelihood to recommend; measures satisfaction with a specific experience. Many teams track both.
What tools help collect UX metrics (analytics + research)?
For ux analytics tools use GA4/Amplitude; for usability testing software use user testing platforms (e.g., UXArmy, Lookback, Maze); for IA, try card sorting tools and tree testing software (including tree testing tools free).