Your team ships an update. The conversion numbers look fine. But users keep dropping at the same screen, and no one can explain why. That’s the gap that how to measure UX performance is designed to close. Forrester puts the ROI of UX investment at $100 for every $1 spent. The right metrics tell you exactly where users struggle. Start with UX metrics and usability data to build your baseline.
The metrics and benchmarks here come from usability research by Measuring, the Nielsen Norman Group, and Google’s HEART framework team.
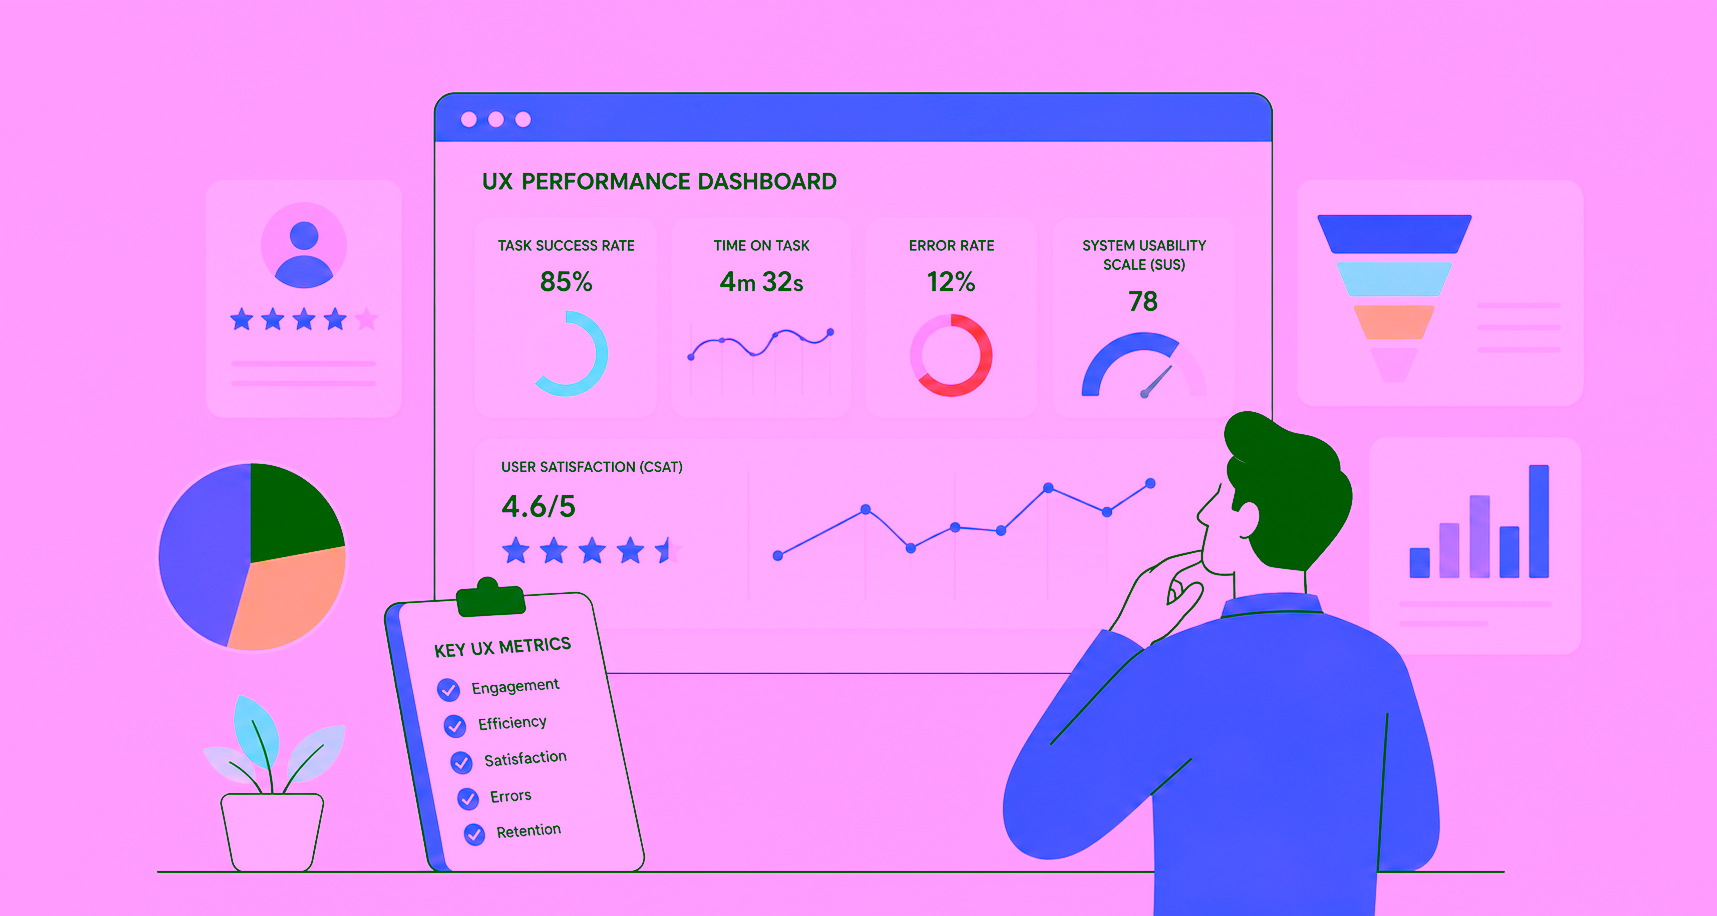
How to measure UX performance: you track six core metrics:
- Task success rate: percentage of users who complete a task correctly
- Time on task: how long users take to finish a flow
- Error rate: how often users make mistakes in a flow
- System Usability Scale (SUS): perceived ease of use scored 0 to 100
- NPS: likelihood to recommend the product
- CSAT: satisfaction with a specific interaction
Behavioral metrics come from usability testing. Attitudinal metrics come from post-session surveys.
Key Takeaways
- Task success rate and time on task are the two behavioral metrics most directly tied to usability.
- SUS scores below 68 signal product-wide problems that will hit retention.
- Analytics tools measure all visitors, including those who never intended to complete a task; usability testing only counts users who were genuinely attempting to complete one.
- The HEART framework, developed by Google, maps UX performance metrics to business goals by selecting only the dimensions relevant to your current product stage.
- Behavioral and attitudinal data each answer a different question; you need both on the table.
What Are the Key Metrics for User Experience Every Product Team Should Track?
Metrics for user experience split into two groups: behavioral and attitudinal. Behavioral metrics show where users fail. Attitudinal metrics show how they feel about the experience. You need both to get a complete picture. The six below cover most product teams at any stage.
| Metric | Category | What It Measures | How to Collect It | Benchmark |
| Task Success Rate | Behavioral | % of users who complete a task correctly | Usability testing, moderated or unmoderated | Below 78% signals friction |
| Time on Task | Behavioral | How long users take to finish a flow | Session recordings, usability testing | Track against your own baseline |
| Error Rate | Behavioral | How often users make mistakes in a flow | Usability testing, navigation path analysis | Above 10% needs a fix |
| System Usability Scale (SUS) | Attitudinal | Perceived ease of use, scored 0 to 100 | Post-session survey, 10 standardized questions | Below 68 is below average; 80+ is top 10% |
| Net Promoter Score (NPS) | Attitudinal | Likelihood to recommend the product | In-app or email survey | Watch the trend, not the number |
| CSAT | Attitudinal | Satisfaction with a specific interaction | Survey at the point of task completion | Below 70% needs attention |
SUS benchmarks sourced from Jeff Sauro and James Lewis, Quantifying the User Experience, 2nd edition (2016).
Why Standard Analytics Tools Won’t Give You Accurate UX Data
Most product teams open GA4 to measure user experience. That’s a reasonable starting point. But it has a real flaw. A 2023 paper in ACM Interactions by researcher Maximilian Speicher confirmed that none of the metrics readily available from web analytics can reliably measure user experience. Bounce rate, session duration, and conversion rate measure all traffic. That includes people who had no intent to complete a task, people who landed by accident, and people who left in the first five seconds.
Usability testing only counts users who were genuinely attempting the task. The numbers those two groups produce don’t look anything alike.
Research from the Baymard Institute found that 90% of users have stopped using an app due to poor performance, a figure that held consistent through their 2025 ecommerce UX review. Your analytics dashboard won’t tell you why they left.
- Analytics averages across every visitor, including accidental arrivals. Usability testing only counts users attempting the task.
- Session duration shows how long someone stayed, not whether they succeeded or gave up.
- Heatmaps show where users hesitated before clicking. Analytics click maps only show where users clicked.
- Error rates only mean something when users follow a structured task. Free-browsing data produces noise.
- SUS and CSAT scores must be collected right after a session. Post-visit surveys suffer from recall bias.
Use analytics to spot where numbers drop. Use usability testing to find out why.
How Do You Pick the Right Metrics for Your Product Stage?
There is no single right answer for how to measure user experience across every product stage. New products need to have a task success rate and an error rate first. They show whether your core flow works at all. Mature products shift toward NPS and retention because baseline usability is already set. Picking the wrong metrics for your stage wastes a full research cycle. Learn how to analyze usability test results to get the most from every session.
| Product Stage | Primary Metrics | Secondary Metrics | Best Research Method |
| Pre-launch / Prototype | Task Success Rate, Error Rate, Time on Task | SUS | Unmoderated usability testing |
| Post-launch (0 to 6 months) | Task Success Rate, CSAT, Error Rate | NPS, Time on Task | Unmoderated and moderated testing |
| Scaling (6 months and beyond) | NPS, Retention, Feature Adoption | SUS, CSAT | Moderated research and surveys |
| Redesign / Iteration | SUS, Task Success Rate, Error Rate | Time on Task | Comparative usability testing |
The HEART framework, developed by Google researchers Kerry Rodden, Hilary Hutchinson, and Xin Fu, provides teams with a structured approach to this process. You don’t track all five dimensions at once. You pick the ones that match your current goal, then map specific metrics to each. In 2026, 22% of organizations said research now informs all levels of business strategy, up from just 8% in 2025, per the Maze Future of Research Report.
How UXArmy Helps Product Teams Collect the Right Metrics Faster
Teams at MetLife, Lazada, Standard Chartered, and Grab use UXArmy to run unmoderated usability testing on websites, mobile apps, and Figma prototypes. Every study report comes back with task success rate, error rate, time on task, and navigation path analysis already mapped out. Per-task heatmaps and session recordings sit alongside the data, so you’re not switching between tools to understand what happened. The platform supports testing in 25+ languages and is SOC 2 Type 2 and GDPR-compliant.
Conclusion
Tracking the wrong metrics doesn’t mean you have bad data. It means you’re answering a question your users aren’t asking. Pick the metrics that match where your product is right now, run a structured test, and let real behavior tell you what to fix next.
Are you measuring what users do, or what’s easy to report? Book a demo with UXArmy and find out.
How Senior Product Leaders Should Audit UX Performance
Most UX audits stop at surface metrics. A senior leader’s job is to go one level deeper: not just what the numbers say, but whether the team is measuring the right things for the right stage.
Start with a metrics audit, not a design audit. Pull your last three releases. For each one, ask whether the task success rate moved, the error rate dropped, or the SUS score changed. If your team can’t answer those three questions, the measurement system is broken before the UX is.
The second thing to check is where your data is coming from. If every UX decision traces back to GA4 or Hotjar, you’re working with population-level data, not task-level data. Senior leaders should require at least one round of structured usability testing per quarter, separate from analytics review.
The third lever is resolution speed. Most teams find a UX problem and schedule it for the next sprint. The faster path is a rapid test-fix-retest cycle: identify the friction point in a five-participant session, ship a targeted fix, retest within two weeks. UXArmy’s unmoderated testing makes that cycle fast enough to run inside a single sprint. Most teams complete a full test-fix-retest loop in under two weeks.
Start Measuring What Actually Matters
Pick two behavioral metrics and one attitudinal metric. Run your first usability test with five to seven participants. One structured session will show you more than a month of traffic reports. Try UXArmy free and run your first study today.
This article is for informational purposes only. Verify current UX benchmarks, platform capabilities, and research standards with a qualified UX professional before making decisions.
FAQs on How to Measure UX Performance
What is a good task completion rate in UX?
According to MeasuringU, 78% is the median task success rate across hundreds of usability studies, making it a reasonable threshold for a well-designed flow. Anything below that suggests real friction, not occasional confusion. Tracking your own baseline over time and watching whether task success rate improves after each design change tells you more than any fixed industry number.
What is the difference between NPS and CSAT in UX measurement?
NPS measures whether users would recommend your product to someone else. CSAT measures satisfaction with a specific interaction or task. You’d use NPS to track overall product sentiment and CSAT to evaluate a particular flow, such as onboarding or checkout. One thing teams often miss: NPS can drop weeks after a bad experience, so it rarely tells you which specific interaction caused the problem
How many participants do you need for usability testing to get reliable UX metrics?
Five to seven participants will surface most usability issues in a single round of testing. Larger sample sizes matter for quantitative studies where you need reliable results for UX performance metrics such as task success rates or SUS scores. For early-stage qualitative research, five is enough to spot patterns and prioritize fixes.
What does the HEART framework measure?
HEART stands for Happiness, Engagement, Adoption, Retention, and Task Success. Google researchers developed it to help teams select user-centered metrics at scale. You don’t track all five at once. You pick the dimensions that match your current product goal, then map specific metrics to each using the Goals, Signals, Metrics model. Most teams find two or three dimensions are enough to start.
How often should you review UX performance metrics?
A good rule of thumb is to tie your review cadence to your release cycle, not the calendar. Task success rate and error rate are worth checking after every significant change. NPS and CSAT work on a monthly cadence. SUS is most useful at milestones like before and after a redesign. Reviewing too often without new data between sessions adds noise, not clarity.